لیست کشور های جهان بر اساس جمعیت
| Country/territory/entity | Population | Date | % of world population | Source | |
|---|---|---|---|---|---|
| — | 6,671,226,000 | July 1, 2007 | 100% | UN estimate | |
| 1 | 1,324,648,000 | June 29, 2008 | 19.86% | Chinese Population clock | |
| 2 | 1,134,725,000 | June 29, 2008 | 17.01% | Indian Population clock | |
| 3 | 304,464,000 | June 29, 2008 | 4.56% | Official USA Population clock | |
| 4 | 231,627,000 | 3.47% | UN estimate | ||
| 5 | 187,108,615 | June 23, 2008 | 2.8% | Official Brazilian Population clock | |
| 6 | 163,673,000 | June 29, 2008 | 2.45% | Official Pakistani Population clock | |
| 7 | 158,665,000 | 2.38% | UN estimate | ||
| 8 | 148,093,000 | 2.22% | UN estimate | ||
| 9 | 141,912,800 | May 1, 2008 | 2.13% | Federal State Statistics Service | |
| 10 | 127,690,000 | May 1, 2008 | 1.91% | Official Japan Statistics Bureau estimate | |
| 11 | 106,682,500 | mid-2008 | 1.6% | INEGI projection | |
| 12 | 88,574,614 | August 1, 2007 | 1.33% | ||
| 13 | 87,375,000 | 1.31% |
UN estimate | ||
| 14 | 82,217,800 | December 31, 2007 | 1.23% | Federal Statistics Office estimate | |
| 15 | 77,127,000 | July 2007 | 1.16% | ||
| 16 | 75,498,000 | 1.13% |
UN estimate | ||
| 17 | 70,586,256 | December 31, 2007 | 1.06% | Turkish Statistical Institute | |
| 18 | 70,495,782 | November, 2006 | 1.06% | ||
| 19 | 64,473,140 | January 1, 2008 | 0.97% | Official INSEE estimate | |
| 20 | 63,038,247 | December 31, 2007 | 0.94% | ||
| 21 | 62,636,000 | 0.94% | UN estimate | ||
| 22 | 60,587,300 | June 30, 2006 | 0.91% | Official ONS estimate | |
| 23 | 59,536,507 | October 31, 2007 | 0.89% | Official Istat estimate | |
| 24 | 48,798,000 | 0.73% |
UN estimate | ||
| 25 | 48,224,000 | 0.72% | UN estimate | ||
| 26 | 47,850,700 | July 1, 2007 | 0.72% | Official Stat SA estimate | |
| 27 | 46,263,079 | May 1, 2008 | 0.69% | Official UKRSTAT estimate | |
| 28 | 46,063,000 | January 1, 2008 | 0.68% | Official INE estimate | |
| 29 | 44,090,118 | May 5, 2008 | 0.66% | Official Colombian Population clock | |
| 30 | 41,000,000 | September 2007 | 0.61% | Official INDEC estimate | |
| 31 | 40,454,000 | 0.61% | UN estimate | ||
| 32 | 38,560,000 | 0.58% | UN estimate | ||
| 33 | 38,115,967 | June 30, 2007 | 0.57% | Official GUS estimate | |
| 34 | 37,538,000 | 0.56% | UN estimate | ||
| 35 | 33,858,000 | 0.51% | UN estimate | ||
| 36 | 33,304,000 | June 29, 2008 | 0.5% | Official Canadian Population clock | |
| 37 | 31,224,000 | 0.47% | UN estimate | ||
| 38 | 30,884,000 | 0.46% | UN estimate | ||
| 39 | 28,993,000 | 0.43% | UN estimate | ||
| 40 | 28,750,770 | June 30, 2007 | 0.43% | Official INEI estimate[4] | |
| 41 | 28,196,000 | 0.42% | UN estimate | ||
| 42 | 27,933,000 | Jun 27, 2008 | 0.42% | Official Venezuelan Population clock | |
| 43 | 27,495,000 | June 27, 2008 | 0.41% | Department of Statistics Malaysia | |
| 44 | 27,372,000 | 0.41% | UN estimate | ||
| 45 | 27,145,000 | 0.41% | UN estimate | ||
| 46 | 24,735,000 | 0.37% | UN estimate | ||
| 47 | 23,790,000 | 0.36% | UN estimate | ||
| 48 | 23,478,000 | 0.35% | UN estimate | ||
| 49 | 22,990,000 | April 30, 2008 | 0.34% | Official National Statistics Taiwan estimate | |
| 50 | 22,389,000 | 0.34% | UN estimate | ||
| 51 | 21,438,000 | 0.32% | UN estimate | ||
| 52 | 21,397,000 | 0.32% | UN estimate | ||
| 53 | 21,350,000 | June 30, 2008 | 0.32% | Official Australian Population clock | |
| 54 | 19,929,000 | 0.3% | UN estimate | ||
| 55 | 19,683,000 | 0.3% | UN estimate | ||
| 56 | 19,299,000 | 0.29% | UN estimate | ||
| 57 | 19,262,000 | 0.29% | UN estimate | ||
| 58 | 18,549,000 | 0.28% | UN estimate | ||
| 59 | 17,024,000 | 0.26% | UN estimate | ||
| 60 | 16,598,074 | June 30, 2007 | 0.25% | Official INE projection | |
| 61 | 16,428,071 | June 26, 2008 | 0.25% | Official Netherlands Population clock | |
| 62 | 15,422,000 | 0.23% | UN estimate | ||
| 63 | 14,784,000 | 0.22% | UN estimate | ||
| 64 | 14,444,000 | 0.22% | UN estimate | ||
| 65 | 14,226,000 | 0.21% | UN estimate | ||
| 66 | 13,925,000 | 0.21% | UN estimate | ||
| 67 | 13,354,000 | 0.2% | UN estimate | ||
| 68 | 13,349,000 | 0.2% | UN estimate | ||
| 69 | 13,341,000 | 0.2% | UN estimate | ||
| 70 | 12,379,000 | 0.19% | UN estimate | ||
| 71 | 12,337,000 | 0.18% | UN estimate | ||
| 72 | 11,922,000 | 0.18% | UN estimate | ||
| 73 | 11,268,000 | 0.17% | UN estimate | ||
| 74 | 11,147,000 | 0.17% | UN estimate | ||
| 75 | 10,781,000 | 0.16% | UN estimate | ||
| 76 | 10,623,000 | 0.16% | UN estimate | ||
| 77 | 10,584,534 | January 1, 2007 | 0.16% | Official Statbel estimate | |
| 78 | 10,403,136 | March 31, 2008 | 0.16% | Official ČSÚ estimate | |
| 79 | 10,327,000 | 0.15% | UN estimate | ||
| 80 | 10,043,000 | January 31, 2008 | 0.15% | Hungarian Central Statistical Office | |
| 81 | 9,858,000 | 0.15% | UN estimate | ||
| 82 | 9,760,000 | 0.15% | UN estimate | ||
| 83 | 9,725,000 | 0.15% | UN estimate | ||
| 84 | 9,690,000 | December 31, 2007 | 0.15% | Official statistics of Belarus | |
| 85 | 9,598,000 | 0.14% | UN estimate | ||
| 86 | 9,525,000 | 0.14% | UN estimate | ||
| 87 | 9,370,000 | 0.14% | UN estimate | ||
| 88 | 9,201,650 | April 30, 2008 | 0.14% | Statistics Sweden | |
| 89 | 9,033,000 | 0.14% | UN estimate | ||
| 90 | 8,699,000 | 0.13% | UN estimate | ||
| 91 | 8,508,000 | 0.13% | UN estimate | ||
| 92 | 8,467,000 | 0.13% | UN estimate | ||
| 93 | 8,340,924 | April 1, 2008 | 0.12% | Official Statistics Austria estimate | |
| 94 | 7,640,238 | December 31, 2007 | 0.11% | National Statistical Institute | |
| 95 | 7,628,600 | April 30, 2008 | 0.11% | Swiss Federal Statistical Office | |
| 96 | 7,282,400 | April 30, 2008 | 0.11% | Israeli Central Bureau of Statistics | |
| 97 | 7,106,000 | 0.11% | UN estimate | ||
| — | 6,963,100 | December 31, 2007 | 0.11% | Census and Statistics Department of Hong Kong | |
| 98 | 6,857,000 | 0.1% | UN estimate | ||
| 99 | 6,736,000 | 0.1% | UN estimate | ||
| 100 | 6,585,000 | 0.099% | UN estimate | ||
| 101 | 6,331,000 | 0.095% | UN estimate | ||
| 102 | 6,160,000 | 0.092% | UN estimate | ||
| 103 | 6,127,000 | 0.092% | UN estimate | ||
| 104 | 5,924,000 | 0.089% | UN estimate | ||
| 105 | 5,866,000 | 0.088% | UN estimate | ||
| 106 | 5,859,000 | 0.088% | UN estimate | ||
| 107 | 5,603,000 | 0.084% | UN estimate | ||
| 108 | 5,482,266 | March 31, 2008 | 0.082% | Statistics Denmark | |
| 109 | 5,402,273 | March 31, 2008 | 0.081% | Statistical Office of the Slovak Republic | |
| 110 | 5,317,000 | 0.08% | UN estimate | ||
| 111 | 5,313,026 | June 27, 2008 | 0.08% | Official Finnish Population clock | |
| 112 | 4,965,000 | 0.074% | UN estimate | ||
| 113 | 4,851,000 | 0.073% | UN estimate | ||
| 114 | 4,769,100 | June 27, 2008 | 0.071% | Official Norwegian Population clock | |
| 115 | 4,588,600 | mid-2007 | 0.069% | Statistics Singapore | |
| 116 | 4,555,000 | 0.068% | UN estimate | ||
| 117 | 4,468,000 | 0.067% | UN estimate | ||
| 118 | 4,395,000 | 0.066% | UN estimate | ||
| 119 | 4,380,000 | 0.066% | UN estimate | ||
| 120 | 4,343,000 | 0.065% | UN estimate | ||
| 121 | 4,339,000 | April 30, 2007 | 0.065% | Official CSO Ireland Statistics | |
| 122 | 4,268,330 | June 27, 2008 | 0.064% | Official New Zealand Population clock | |
| 123 | 4,099,000 | 0.061% | UN estimate | ||
| 124 | 4,017,000 | 0.06% | UN estimate | ||
| 125 | 3,991,000 | 0.06% | UN estimate | ||
| 126 | 3,935,000 | 0.059% | UN estimate | ||
| 127 | 3,794,000 | 0.057% | UN estimate | ||
| 128 | 3,768,000 | 0.056% | UN estimate | ||
| 129 | 3,750,000 | 0.056% | UN estimate | ||
| — | 3,500,000 | Date unknown | 0.052% | Somaliland government | |
| 130 | 3,361,100 | April 1, 2008 | 0.051% | Statistics Lithuania | |
| 131 | 3,343,000 | 0.05% | UN estimate | ||
| 132 | 3,340,000 | 0.05% | UN estimate | ||
| 133 | 3,190,000 | 0.048% | UN estimate | ||
| 134 | 3,124,000 | 0.047% | UN estimate | ||
| 135 | 3,002,000 | 0.045% | UN estimate | ||
| 136 | 2,851,000 | 0.043% | UN estimate | ||
| 137 | 2,714,000 | 0.041% | UN estimate | ||
| 138 | 2,629,000 | 0.039% | UN estimate | ||
| 139 | 2,595,000 | 0.039% | UN estimate | ||
| 140 | 2,268,000 | May 1, 2008 | 0.034% | Latvijas Statistika | |
| — | 2,126,708 | 2007 | 0.031% | The World Factbook | |
| 141 | 2,074,000 | 0.031% | UN estimate | ||
| 142 | 2,038,000 | 0.031% | UN estimate | ||
| 143 | 2,028,683 | June 23, 2008 | 0.031% | Official Slovenian population clock | |
| 144 | 2,008,000 | 0.03% | UN estimate | ||
| 145 | 1,882,000 | 0.028% | UN estimate | ||
| 146 | 1,709,000 | 0.026% | UN estimate | ||
| 147 | 1,695,000 | 0.025% | UN estimate | ||
| 148 | 1,340,600 | January 1, 2008 | 0.02% | Statistics Estonia | |
| 149 | 1,333,000 | 0.02% | UN estimate | ||
| 150 | 1,331,000 | 0.02% | UN estimate | ||
| 151 | 1,262,000 | 0.019% | UN estimate | ||
| 152 | 1,155,000 | 0.017% | UN estimate | ||
| 153 | 1,141,000 | 0.017% | UN estimate | ||
| 154 | 855,000 | 0.013% | UN estimate | ||
| 155 | 841,000 | 0.013% | UN estimate | ||
| 156 | 833,000 | 0.012% | UN estimate | ||
| 157 | 827,900 | 2007 | 0.013% | Fiji Islands Bureau of Statistics | |
| — | 793,000 | January 1, 2007 | 0.012% | Official INSEE estimate | |
| 158 | 760,168 | Date unknown | 0.011% | Kingdom of Bahrain Government Statistics | |
| 159 | 738,000 | 0.011% | UN estimate | ||
| 160 | 682,000 | July 2007 | 0.01% | World Gazetteer projection | |
| 161 | 658,000 | 0.01% | UN estimate | ||
| 162 | 598,000 | 0.009% | UN estimate | ||
| — | 538,100 | December 31, 2007 | 0.008% | Statistics and Census Service of Macau | |
| 163 | 530,000 | 0.008% | UN estimate | ||
| 164 | 507,000 | 0.008% | UN estimate | ||
| 165 | 506,992 | 0.007% | [1] | ||
| 166 | 480,000 | 0.007% | UN estimate | ||
| 167 | 483,800 | January 1, 2008 | 0.007% | Le portail des statistiques du Luxenbourg | |
| 168 | 458,000 | 0.007% | UN estimate | ||
| — | 408,000 | January 1, 2007 | 0.006% | INSEE estimate (minus the populations of Saint Martin and Saint Barthélemy) | |
| 169 | 407,000 | 0.006% | UN estimate | ||
| — | 401,000 | January 1, 2007 | 0.006% | Official INSEE estimate | |
| 170 | 390,000 | 0.006% | UN estimate | ||
| 171 | 331,000 | 0.005% | UN estimate | ||
| 172 | 316,252 | April 1, 2008 | 0.005% | Hagstofa Íslands | |
| 173 | 306,000 | 0.005% | UN estimate | ||
| 174 | 294,000 | 0.004% | UN estimate | ||
| 175 | 288,000 | 0.004% | UN estimate | ||
| — | 259,596 | August 20, 2007 | 0.004% | August 2007 census | |
| — | 244,600 | January 1, 2008 | 0.004% | Official ISEE estimate | |
| 176 | 226,000 | 0.003% | UN estimate | ||
| — | 209,000 | January 1, 2007 | 0.003% | Official INSEE estimate | |
| 177 | 192,000 | 0.003% | UN estimate | ||
| 178 | 188,540 | 2008 | 0.003% | Samoa Statistics Department | |
| — | 186,452 | July 31, 2007 | 0.003% | July 2007 census | |
| 179 | 173,000 | 0.003% | UN estimate | ||
| 180 | 165,000 | 0.002% | UN estimate | ||
| 181 | 158,000 | 0.002% | UN estimate | ||
| 182 | 120,000 | 0.002% | UN estimate | ||
| 183 | 111,000 | 0.002% | UN estimate | ||
| 184 | 111,000 | 0.002% | UN estimate | ||
| 185 | 106,000 | 0.002% | UN estimate | ||
| 186 | 104,000 | 0.002% | UN estimate | ||
| 187 | 100,000 | 0.001% | UN estimate | ||
| 188 | 95,000 | 0.001% | UN estimate | ||
| 189 | 89,300 | December 31, 2006 | 0.001% | [2] | |
| 190 | 87,000 | 0.001% | UN estimate | ||
| 191 | 85,000 | 0.001% | UN estimate | ||
| 192 | 84,000 | 0.001% | UN estimate | ||
| 193 | 83,137 | December 31, 2007 | 0.001% | [3] | |
| 194 | 80,058 | 2006 | 0.001% | Isle of Man Government | |
| 195 | 67,000 | 0.001% | UN estimate | ||
| 196 | 67,000 | 0.001% | UN estimate | ||
| 197 | 65,726 | July 2008 | 0.001% | The World Factbook | |
| 198 | 65,000 | 0.001% | UN estimate | ||
| 199 | 59,000 | 0.001% | UN estimate | ||
| 200 | 58,000 | 0.001% | UN estimate | ||
| 201 | 50,000 | 0.001% | UN estimate | ||
| 202 | 48,570 | May 1, 2008 | 0.001% | Official statistics of the Faroe Islands | |
| 203 | 47,000 | 0.001% | UN estimate | ||
| 204 | 35,365 | December 31, 2007 | 0.0005% | Statistik Liechtenstein | |
| — | 33,102 | October 2004 | 0.0005% | October 2004 supplementary census | |
| 205 | 33,000 | 0.0005% |
UN estimate | ||
| 206 | 31,000 | 0.0005% | UN estimate | ||
| 207 | 28,875 | 2006 | 0.0004% | Government of Gibraltar - information services | |
| 208 | 26,000 | 0.0004% | UN estimate | ||
| 209 | 23,000 | 0.0003% | UN estimate | ||
| 210 | 20,200 | September 2007 | 0.0002% | Statistics office | |
| 211 | 20,000 | 0.0003% | UN estimate | ||
| — | 15,000 | 0.0002% | UN estimate | ||
| 212 | 13,000 | 0.0002% | UN estimate | ||
| 213 | 11,000 | 0.0002% | UN estimate | ||
| 214 | 10,000 | 0.0001% | UN estimate | ||
| — | 8,450 | January 1, 2007 | 0.0001% | January 2007 census | |
| 215 | 6,600 | 0.0001% | UN estimate | ||
| — | 6,125 | January 1, 2006 | 0.0001% | January 2006 census | |
| 216 | 5,900 | 0.0001% | UN estimate | ||
| 217 | 3,000 | 0.00005% | UN estimate | ||
| 218 | 1,600 | 0.00003% | UN estimate | ||
| 219 | 1,400 | 0.00003% | UN estimate | ||
| 220 | 800 | 0.00002% | UN estimate | ||
| 221 | 50 | 0.000001% | UN estimate |
نقشه توزیع جمعیت جهان در سال ۲۰۰۷
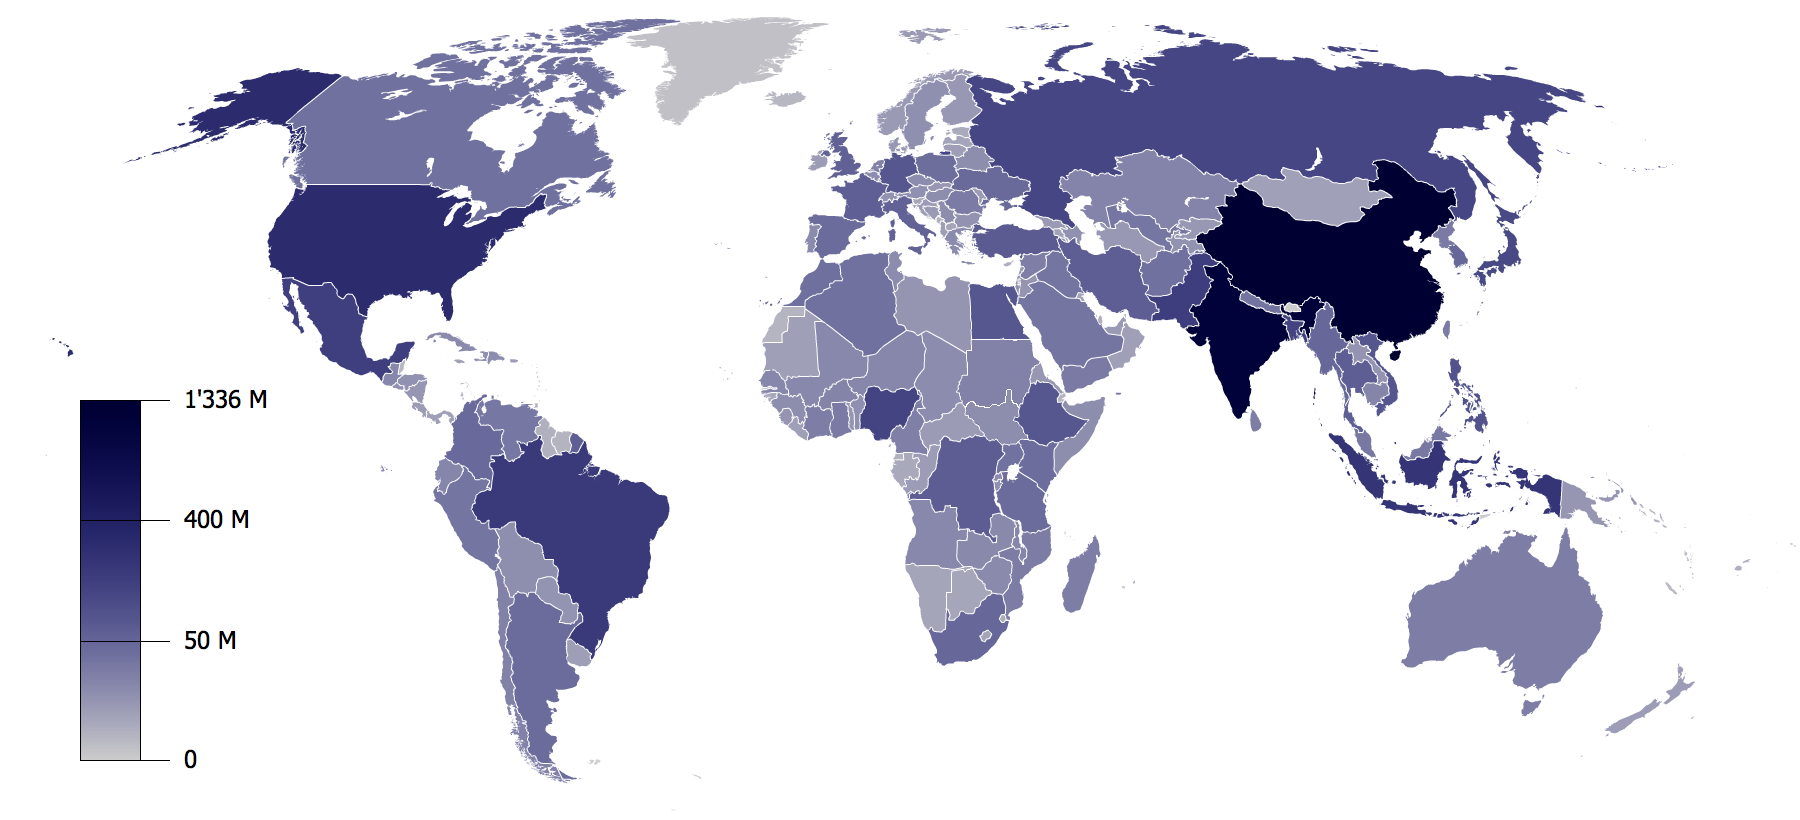
( تصویر را سیو کنید و آن را در اندازه اصلی ببینید ! )
لیست کشور های جهان را بر اساس جمعیت و درصد اشغال جمعیت
رتبه ی ایران در آن هجدهم ( ۱۸ ) می باشد !
با جمعیتی بالغ بر 70,495,782 نفر که 1.06% درصد از جمعیت جهان را به خود اختصاص داه است .
در صدر جدول هم چین با بیش از 6,671,226,000 نفر بیشترین جمعیت را به خود اختصاص داده است .
لینک مفید :
http://www.os-connect.com/pop/pop1.asp?CID=104
برگرفته از دانشنامه آزادی ویکیپدیا
+ نوشته شده در یکشنبه نهم تیر ۱۳۸۷ ساعت 20:59 توسط محمد میرزایی
|
 سلام و درود فراوان بر بازدید کنندگان محترم .